Why Stress, Sleep, and Activity Often Appear in Blood Pressure Data
Understanding the patterns in your blood pressure logs and what they reveal about daily life influences
If you've ever looked at blood pressure logs over several days or weeks, you've probably noticed something interesting: the numbers don't just go up and down randomly. Patterns often seem to line up with stressful days, short nights, or changes in activity.
This article explains why those factors frequently appear in blood pressure data — without offering medical guidance. Think of this as a guide to interpreting patterns, not acting on them.
Blood Pressure Is Contextual, Not Static
Blood pressure is often treated like a fixed number, but in reality it behaves more like a dynamic signal. It responds to internal states such as alertness and fatigue, external demands like workload and movement, and timing factors including time of day and daily routines.
When people start logging measurements regularly, these influences become visible — sometimes for the first time. This contextual nature of blood pressure is what makes long-term tracking so valuable for understanding personal health patterns.
Stress: Why 'Busy Days' Leave a Data Signature
What shows up in the data
During periods people label as stressful, blood pressure data often shows higher variability, elevated short-term peaks, and less predictable patterns. The readings may swing more widely between measurements taken at similar times.
Why this happens (observational view)
Stress activates the body's alert systems, increasing physiological arousal. Even without conscious awareness, this can influence vascular tone, heart activity, and breathing patterns. From a data perspective, stress doesn't always raise blood pressure uniformly — instead, it often increases noise and volatility in the readings.
Sleep: The Quiet Baseline You Only Notice When It's Missing
What shows up in the data
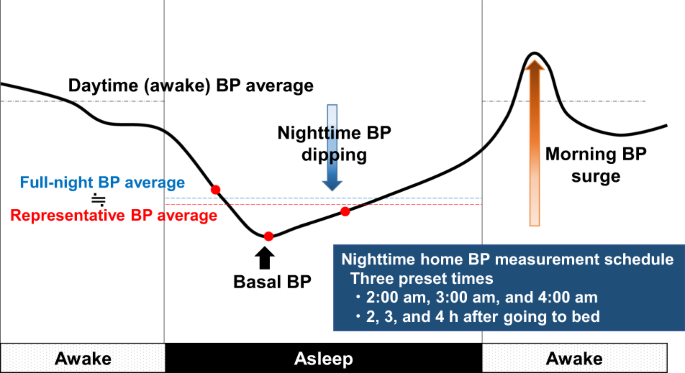
After poor or shortened sleep, blood pressure logs may show higher morning readings, delayed stabilization during the day, and reduced nighttime dipping in continuous datasets. These patterns can persist throughout the entire day following a poor night's rest.
Why sleep matters to patterns
Sleep provides a baseline reset for many physiological systems. When that reset is incomplete, daily rhythms can shift, variability increases, and comparisons to 'normal days' become more noticeable. Importantly, this effect often appears across multiple measurements, not just one isolated reading.
Activity: Movement Leaves a Trace — Even After It Ends
What shows up in the data
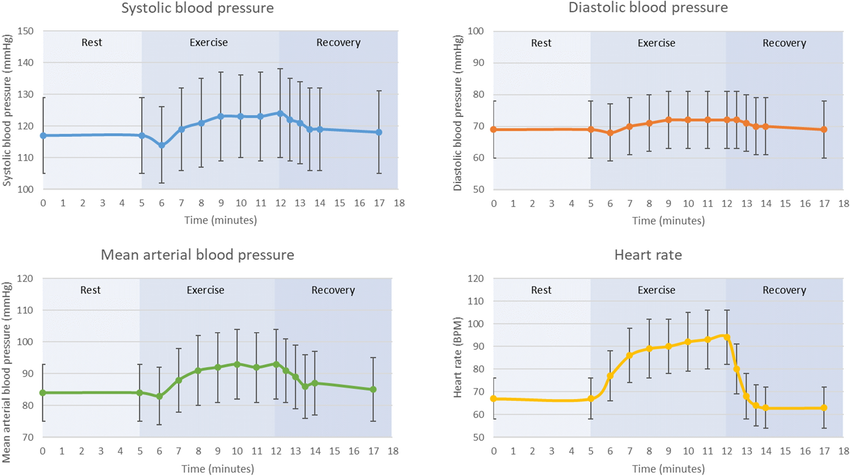
On days with more physical activity, logs may show temporary increases during and shortly after exercise, slower return to baseline values, and greater spread between minimum and maximum values recorded that day.
Why activity shows up later
Physical activity affects blood pressure not only during movement but also during recovery phases. Depending on timing and intensity, this can influence nearby measurements, daily averages, and variability metrics. This is why activity often appears in the data even when measurements are taken at rest hours later.
Correlation Is Not Instruction
A critical point: seeing a pattern does not imply a recommendation. Blood pressure data reflects co-occurrence, not cause-and-effect guidance. Stressful days, short sleep, and active periods often overlap with blood pressure changes — but the data itself does not say what should be changed.
This distinction is essential for responsible interpretation, avoiding overreaction to single readings, and focusing on long-term trends rather than daily fluctuations.
Why These Patterns Matter for Logging Tools
When people log blood pressure alongside contextual information (time, day, activity, notes), something powerful happens: numbers gain meaning. Instead of isolated values, users can observe recurring patterns, personal baselines, and differences between 'typical' and 'atypical' days.
This shift — from numbers to patterns — is one of the biggest benefits of consistent tracking. It transforms blood pressure monitoring from a series of disconnected snapshots into a coherent narrative about your body's responses.
The Bigger Picture: Blood Pressure as a Signal
Rather than asking 'Is this number good or bad?' longitudinal data encourages a different question: 'What does my blood pressure tend to do under different conditions?'
Stress, sleep, and activity appear in blood pressure data because they are part of daily life — and blood pressure reflects daily life remarkably well. Understanding this connection helps you become a better observer of your own health patterns.
Understanding Key Terms
Variability
The degree to which measurements fluctuate over time. Higher variability means readings swing more widely between measurements.
Baseline
A personal reference range observed during typical conditions. Your baseline is unique to you and serves as a comparison point.
Circadian Rhythm
Daily biological timing that influences many physiological processes, including natural blood pressure fluctuations throughout the day.
Contextual Data
Information that surrounds a measurement, such as time of day, recent activity, stress level, or personal notes.
Start Observing Your Patterns Today
Understanding how stress, sleep, and activity influence your blood pressure begins with consistent logging. Track your readings and context to reveal your personal patterns.
Important Medical Disclaimer: LogMyVitals is a health tracking tool designed to help you monitor and log your vital metrics such as blood pressure, blood sugar, and weight. This platform is NOT a substitute for professional medical advice, diagnosis, or treatment. The information provided should not be used to diagnose or treat any health condition. Always seek the advice of your physician or other qualified healthcare provider with any questions you may have regarding a medical condition. Never disregard professional medical advice or delay seeking it because of something you have read or tracked on this platform. In case of a medical emergency, call your doctor or emergency services immediately.